gallium-melting2d
English | Japanese
« Home · « Heat transfer and phase change
Enthalpy-porosity thermal LBM -- convection-coupled melting of pure gallium in a side-heated rectangular cavity (the Gau & Viskanta 1986 benchmark). This is the union of two OpenRheo benchmarks: * thermal_cavity2d.cpp -- DDF thermal LBM: a D2Q9 BGK momentum LBM with a Guo (2002) buoyancy forcing, coupled to a D2Q5 advection-diffusion LBM for the temperature (He, Chen & Doolen 1998); * stefan_melting2d.cpp -- the enthalpy method for isothermal solid-liquid phase change: total enthalpy H = cpT + Lfl, liquid fraction fl recovered each step, latent-heat source S = -(L/cp) dfl/dt in the scalar collision (Jiaung, Ho & Kuo 2001). It adds the piece that couples them -- the ENTHALPY-POROSITY momentum treatment of Brent, Voller & Reid, "Enthalpy-Porosity Technique for Modeling Convection-Diffusion Phase Change: Application to the Melting of a Pure Metal", Numerical Heat Transfer 13 (1988) 297-318:
Geometry
Animation
Fields
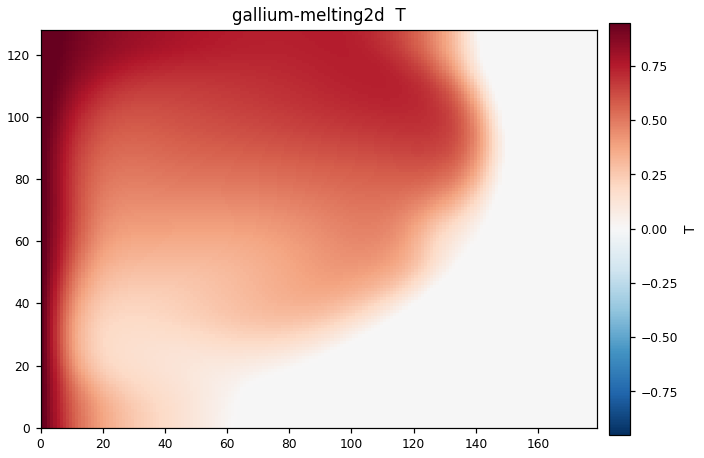
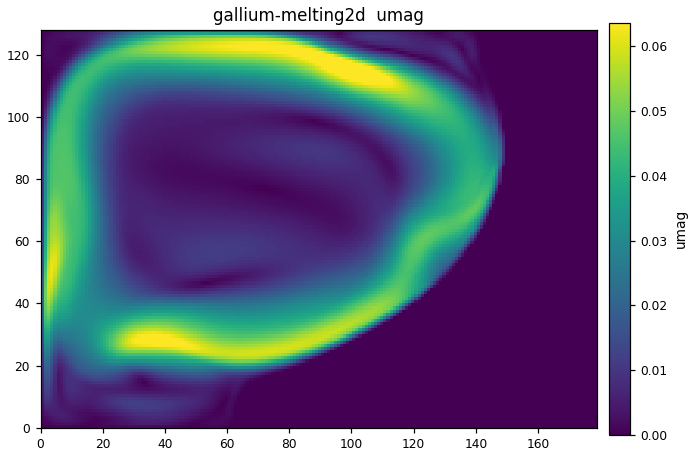
The fields this computation wrote at its last output step, plotted as they are. 3D cases show the mid-plane.
Results
First, an honest statement of the gallery configuration. The argv in runs.json is empty — that is, this run uses the binary's defaults as they are: Nx = 179 × Ny = 128 (W/H = 1.40), Ra = 6e5, Ste = 0.0390, Pr = 0.0216, U = 0.08, C = 1e5, Fo_max = 3.90 (steps = 710374). Ny = 128 is a modest resolution chosen for the gallery, and τ_f = 3ν + 1/2 = 0.50583 sits just above the stability limit. In addition, Validation-Status lists the Gau–Viskanta melt-front comparison for this case as not yet measured — the numbers below are not a quantitative overlay on the experimental photographs, only what the run in this configuration actually showed. Wall-clock 44.63 seconds (CPU 2427.8 seconds, 72 cores).
Checking the mapping: ν = U·H·√(Pr/Ra) = 10.24 × √(3.6e-8) = 1.943e-3 (log 0.00194), α = ν/Pr = 0.08995, gβ = U²/H = 0.0064/128 = 5.000e-5, L = c_pΔT/Ste = 1/0.039 = 25.641, steps = Fo_max·H²/α = 3.9 × 16384/ 0.08995 ≈ 710374 ✓.
- Melt fraction grows from 0.1183 at Fo = 0.32 to 0.6953 at Fo = 3.90, shifting roughly from √t to linear growth. The snapshots are at Fo = 0.41/1.23/2.05/3.90, corresponding to the Gau–Viskanta photograph times of 2/6/10/19 minutes, with melt_frac = 0.1361/0.2817/0.4087/0.6953.
- Front tilt — the point of this benchmark. Initially the front is nearly planar (Fo = 0.32: top/bot = 21.18/19.75), but once the convection roll sets in, the top leads: 58.13/38.64 at Fo = 1.30 and 145.69/81.68 at Fo = 3.90. The RESULT tilt = 145.6880 − 81.6758 = 64.01 cells (= 0.50 H). A planar front would mean pure conduction — this tilt is the evidence that buoyant convection has distorted the front, and it reproduces the qualitative feature of the experimental photographs (faster melting towards the top).
- Ra = 6e5 is the nominal value at the upper end of the Gau–Viskanta range 2e5–6e5 stated in the header.
Governing equations
The enthalpy-porosity method (Brent–Voller–Reid 1988) = the merger of thermal_cavity2d (DDF thermal LBM + Guo buoyancy) and stefan_melting2d (enthalpy phase change) + the momentum treatment that connects the two. The mushy/solid region is regarded as a porous medium whose permeability collapses with the liquid fraction f_l, and a Carman–Kozeny Darcy-type drag is added to the momentum:
\[
\boldsymbol{S}_u=-A(f_l)\,\boldsymbol{u},\qquad
A(f_l)=C\,\frac{(1-f_l)^2}{f_l^3+\epsilon},\qquad C=10^5
\]
In the liquid (f_l = 1) A = 0; in the solid (f_l = 0) A becomes huge and pins u ≈ 0 — the solid stays at rest on the fixed grid without front tracking. The drag is treated semi-implicitly in the velocity update (u = m/(ρ + A/2)), so it is stable for arbitrarily large C. The melt is driven by Boussinesq buoyancy F_y = ρgβ(T − T_m), and a roll that rises along the heated wall → crosses under the ceiling → descends at the front accelerates melting at the top. Governing groups:
\[
Pr=\frac{\nu}{\alpha}=0.0216,\quad
Ste=\frac{c_p\Delta T}{L}=0.039,\quad
Ra=\frac{g\beta\Delta T H^3}{\nu\alpha}=6\times10^5,\quad
Fo=\frac{\alpha t}{H^2}
\]
Because of the low Pr (liquid metal), the thermal boundary layer is thick and τ_g = 0.7698 has ample margin, whereas
on the momentum side τ_f = 0.50583 is on thin ice — the choice of U and Ny sits on this trade-off.
The closures are the same enthalpy_liquid_fraction /
latent_heat_source + mushy_drag_coefficient (closures.hpp) as in stefan-melting2d, and
at the migration the RESULT (melt_frac 0.695253, tilt 64.0122) was confirmed to be bit-identical
(docs/design/module-architecture-design.md).
Code walkthrough
Source (379 lines).
%%{init: {'themeVariables': {'fontSize': '11px'}}}%%
flowchart LR
    H["Left wall T_h (hot)<br/>anti-BB Dirichlet<br/>no-slip"] --> LQ["Melt: D2Q9 BGK<br/>+ Guo buoyancy + Darcy drag<br/>top/bottom adiabatic, no-slip"]
    LQ --> F(("Tilted front<br/>0<f_l<1 partial braking")) --> S["Solid f_l=0<br/>immobilised by Carman–Kozeny"]
S --> C["Right wall T_m (melting point)<br/>Dirichlet"]- Mapping — Derive ν, α, gβ, L from (Ny, Ra, Ste, Pr, U), and set the number of steps automatically from Fo_max.
- Momentum — D2Q9 BGK + Guo buoyancy. Semi-implicit Darcy drag u = m/(ρ + A/2).
- Temperature — D2Q5 + latent-heat source; f_l is recovered from the enthalpy every step.
- Diagnostics — melt_frac and the front (mean/top/bottom) are output periodically, and snapshot CSVs are written at the 4 Gau–Viskanta photograph times.
- Output — RESULT line (melt_frac, front_top/bot, tilt) and the gallery animation (showing the front tilting).
Build & run
cmake -S native -B native/build && cmake --build native/build -j
./native/build/orheo-gallium-melting2d
gallium_melting2d [Ny] [Ra] [Ste] [Pr] [out_prefix] [U] [C] [Nx] [Fo_max]
Cost of the computation that made the figures on this page (Miyabi-G Grace CPU (72 cores, -stdpar=multicore)): 44.6 s wall.
Things to try
- Fill in the missing validation: write a post-processing step that overlays the f_l = 0.5 contour of snap{0..3} on the Gau–Viskanta photograph fronts — the shortest path to turning the 🧩 in Validation-Status into ✅.
- Raise the resolution:
gallium_melting2d 256— τ_f gets even closer to 0.5, so U must be lowered too. Check whether tilt = 64 (0.50 H) is a converged quantity. - C sweep: mushy constant 1e3–1e7. The sensitivity of front width and tilt is exactly one of the main points debated by Brent–Voller–Reid.
- Ra to 2e5: the lower end of the experimental range. How much does the front tilt decrease as convection weakens (with pure conduction it degenerates to the planar front of stefan-melting2d)?
Validation
| Tier | T1 — automatic gate |
| QoI | melt_front |
| Reference | Gau & Viskanta (1986) J.Heat Transfer 108:174 |
| Gate | 🧩 module gate (closures) |
Source & run details
| Item | Value |
|---|---|
| Target | orheo-gallium-melting2d |
| Source | native/benchmarks/gallium_melting2d.cpp |
| Lattice | D2Q9 |
| GPU twin | no |
| Modules | closures.hpp |
| Gallery run | 2026-07-27 @ 7628c0cf |
| Args | `` |
| Wall time | 44.63 s |
| CPU time | 2427.82 s |
| Device | Miyabi-G Grace CPU (72 cores, -stdpar=multicore) |
Computation log
The actual output of this computation (head and tail).
gallium_melting2d Nx=179 Ny=128 (W/H=1.40) Ra=6e+05 Ste=0.0390 Pr=0.0216
  U=0.080 nu=0.00194 alpha=0.08995 gbeta=5.000e-05 L=25.641 C=1.00e+05 tau_f=0.50583 tau_g=0.7698 steps=710374 (Fo_max=3.900)
  step 59180 Fo=0.3249 melt_frac=0.1183 front(mean/top/bot)=21.18/21.18/19.75
  snapshot 0: Fo=0.4100 step=74680 melt_frac=0.1361
  step 118360 Fo=0.6498 melt_frac=0.1816 front(mean/top/bot)=32.49/36.46/27.18
  step 177540 Fo=0.9747 melt_frac=0.2419 front(mean/top/bot)=43.28/51.02/33.01
  snapshot 1: Fo=1.2300 step=224041 melt_frac=0.2817
  step 236720 Fo=1.2996 melt_frac=0.2924 front(mean/top/bot)=52.32/58.13/38.64
  step 295900 Fo=1.6245 melt_frac=0.3419 front(mean/top/bot)=61.20/69.47/43.16
  step 355080 Fo=1.9494 melt_frac=0.3930 front(mean/top/bot)=70.33/84.61/47.97
  snapshot 2: Fo=2.0500 step=373402 melt_frac=0.4087
  step 414260 Fo=2.2743 melt_frac=0.4436 front(mean/top/bot)=79.40/96.25/52.02
  step 473440 Fo=2.5992 melt_frac=0.4941 front(mean/top/bot)=88.43/107.02/55.80
  step 532620 Fo=2.9241 melt_frac=0.5446 front(mean/top/bot)=97.48/117.04/59.01
References
- C. Gau & R. Viskanta, J. Heat Transfer 108 (1986) 174–181 — side-heated gallium melting experiment, front photographs at 2/6/10/19 minutes.
- A. D. Brent, V. R. Voller & K. J. Reid, Numerical Heat Transfer 13 (1988) 297–318 — enthalpy-porosity method.
- W.-S. Jiaung, J.-R. Ho & C.-N. Kuo, Numerical Heat Transfer B 39 (2001) 167–187.
- X. He, S. Chen & G. D. Doolen, J. Comput. Phys. 146 (1998) 282; Z. Guo, C. Zheng & B. Shi, Phys. Rev. E 65 (2002) 046308.