Cross ventilation (crossvent) — comparing 3 methods: 1D, LBM-LES and OpenFOAM¶
English | Japanese
Every number on this page is copied from docs/design/ladder-cases-design-2026-08.md (below, "the design document"). Section numbers are those of that document.
What was compared¶
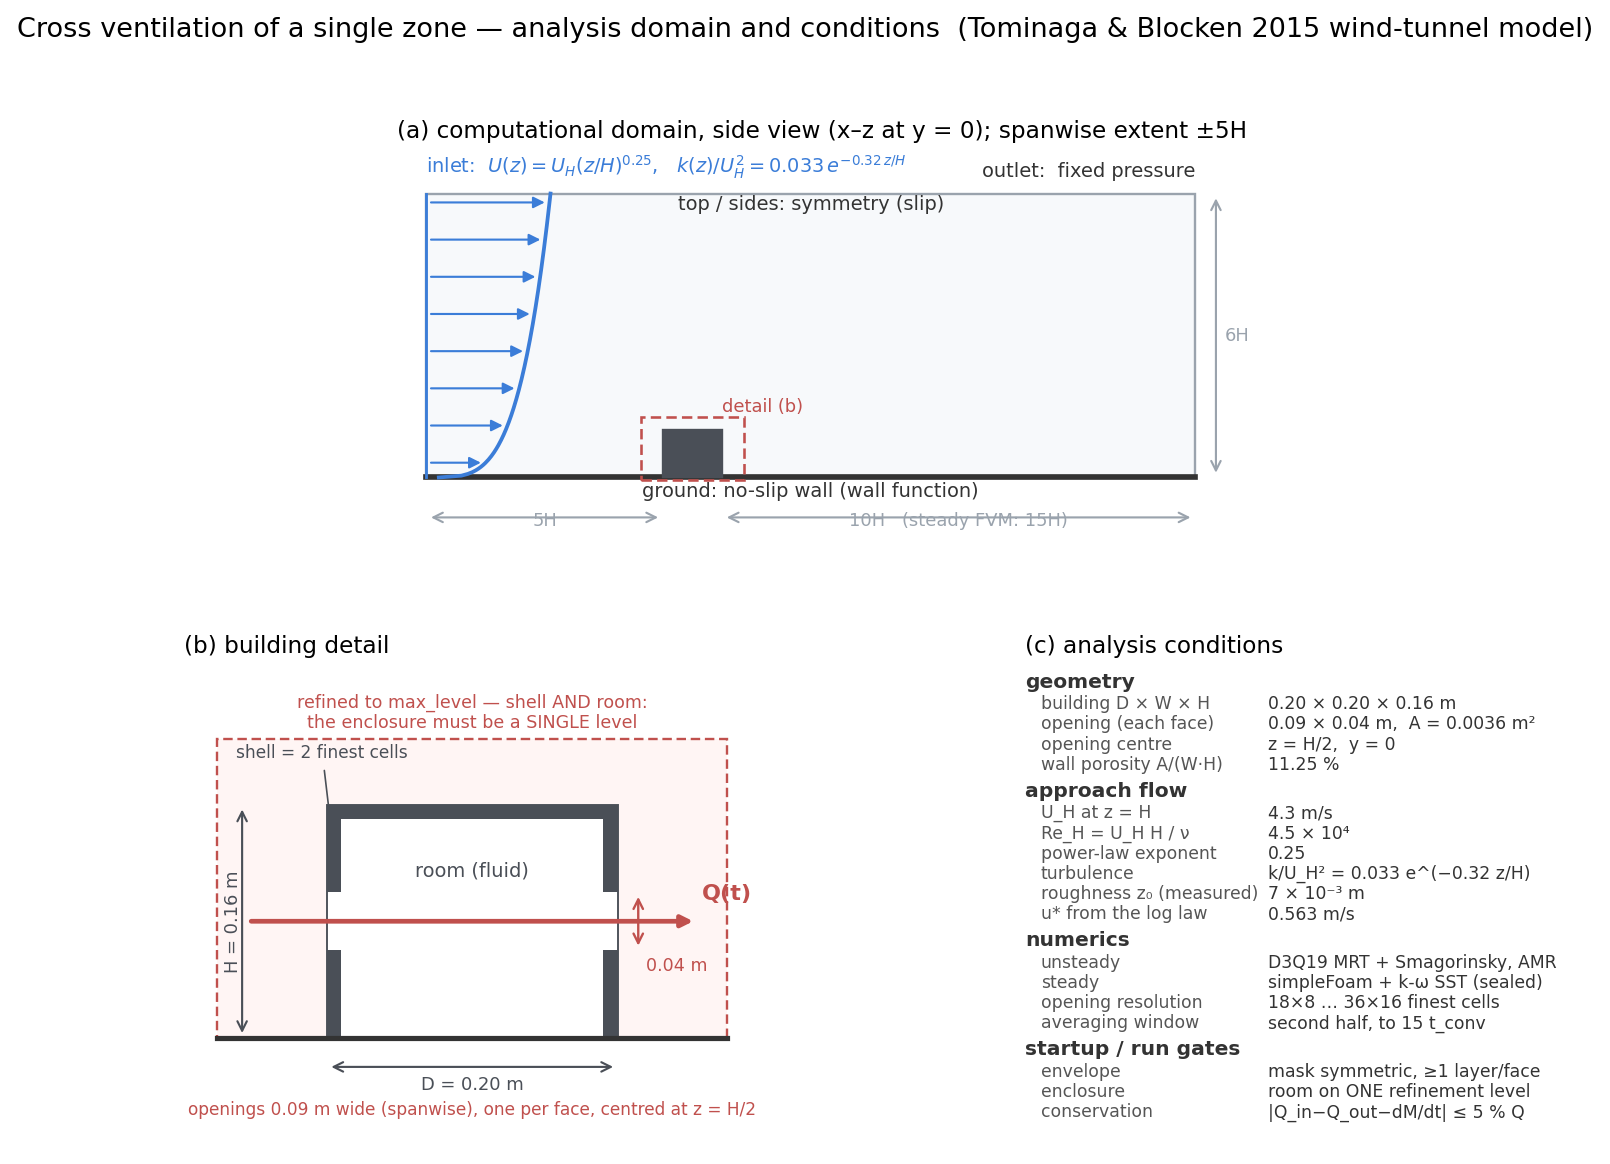
The wind-tunnel experiment of Tominaga & Blocken (2015), Building and Environment 92:452–461: a single-room model with facing openings (0.20 × 0.20 × 0.16 m, openings 3.3 × 10⁻³ m² ×2, power law α = 0.25, U_H = 4.3 m/s, Re_H ≈ 45,000). The quantity compared is the non-dimensional ventilation rate Q* = Q / (U_H · A_opening); the experimental value is 0.25 (tracer-gas method, uncertainty ±7 %).
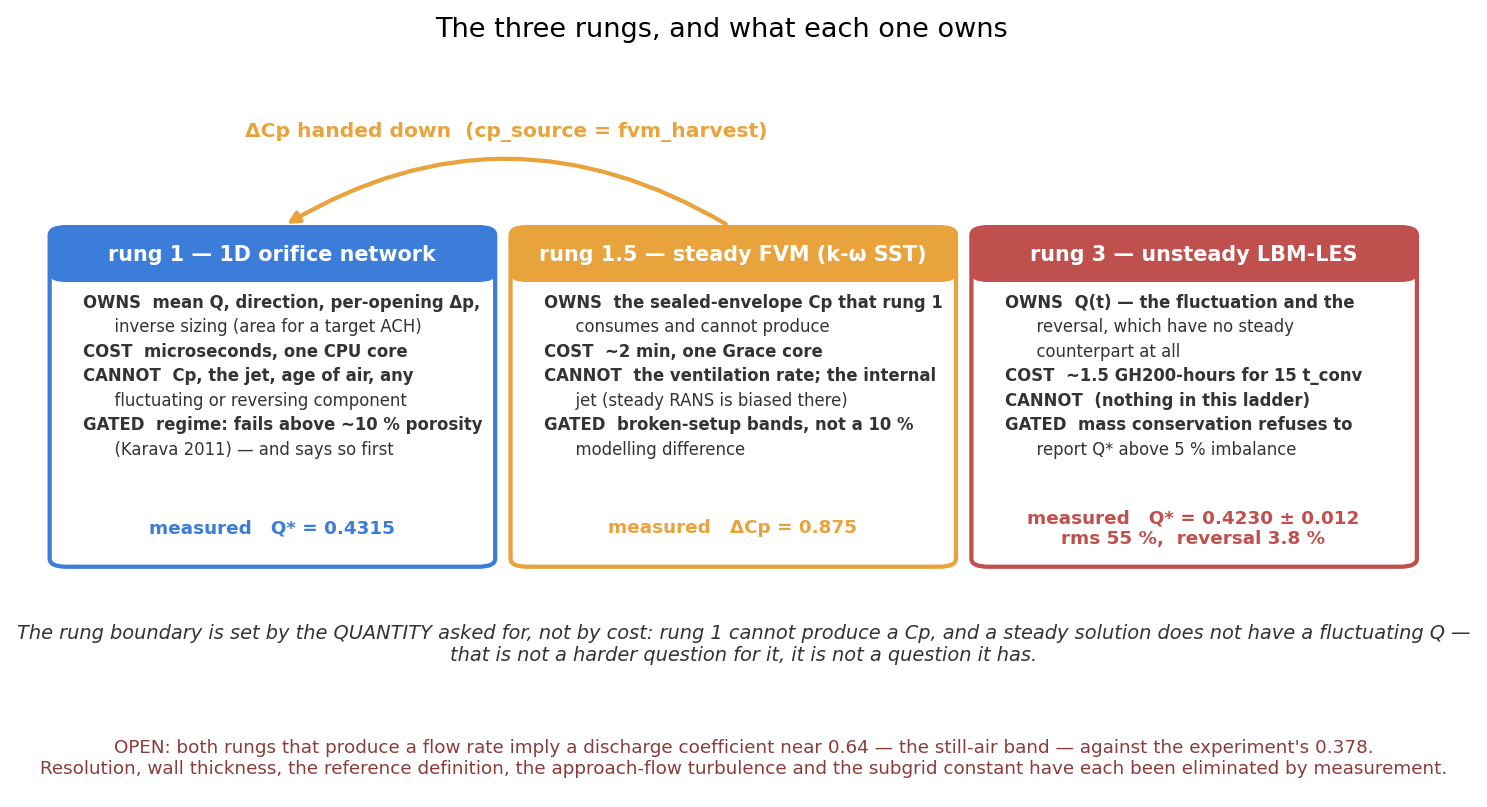
The same problem was solved with 3 independent methods:
| Method | What it is | Source |
|---|---|---|
| 1D | Orifice network of the openings. The wind pressure coefficients Cp are taken from the FVM below | onedim/crossvent.hpp |
| LBM-LES | D3Q19, block-forest AMR, turbulent inflow | forest_crossvent.cpp, job_crossvent.pbs |
| FVM | OpenFOAM simpleFoam, k-ω SST, steady solution with the openings open | job_openfoam_crossvent.pbs |
Results (design document §14)¶
| Method | Q* | Difference from experiment 0.25 |
|---|---|---|
| 1D (using the FVM Cp) | 0.4315 | +73 % |
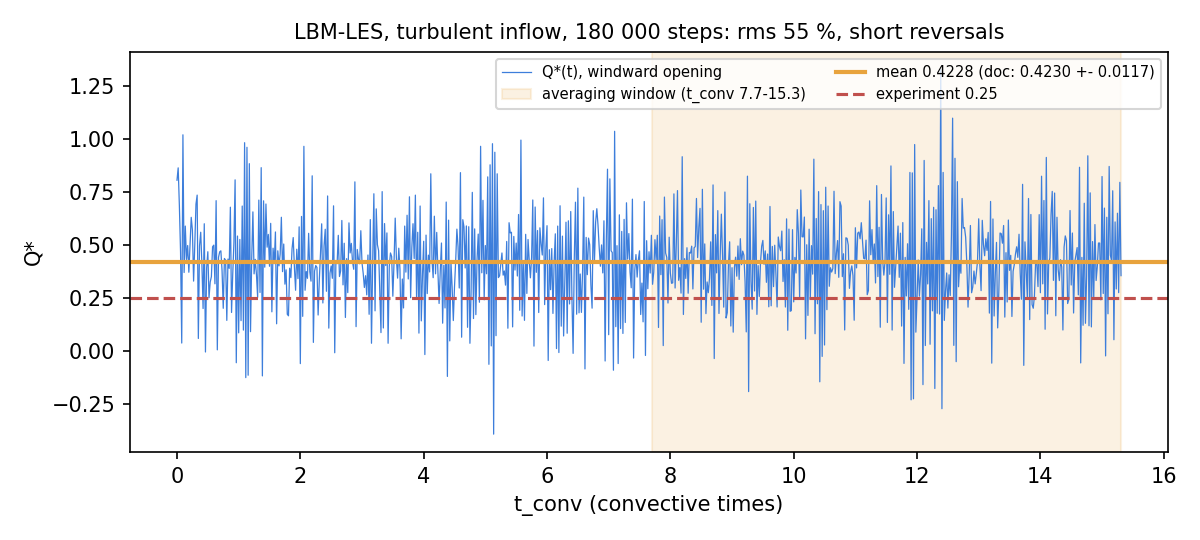
| LBM-LES (180,000 steps, about 1.5 node-hours on short-g) | 0.4230 ± 0.0117 (standard error) | +69 % |
| OpenFOAM k-ω SST (steady) | 0.4364 ± 0.0274 | +75 % |
| Experiment (tracer gas) | 0.250 | — |
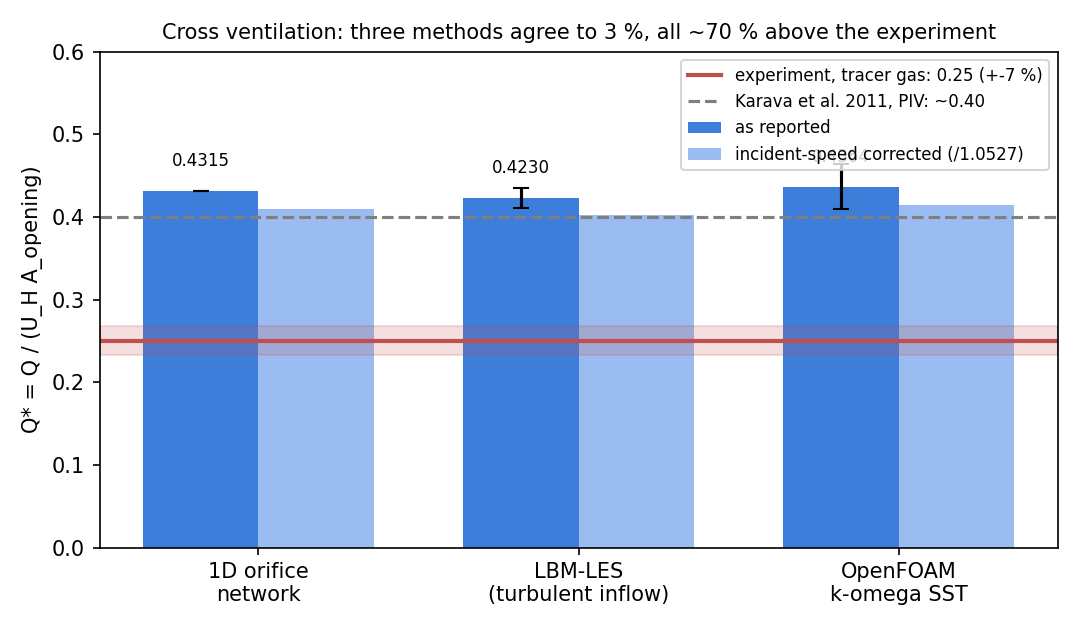
The 3 methods agree with each other within 3 %, and all 3 are about 70 % larger than the experiment. Since 3 methods that differ in discretization, turbulence model, grid and code all line up, this is not a bug in the LBM.
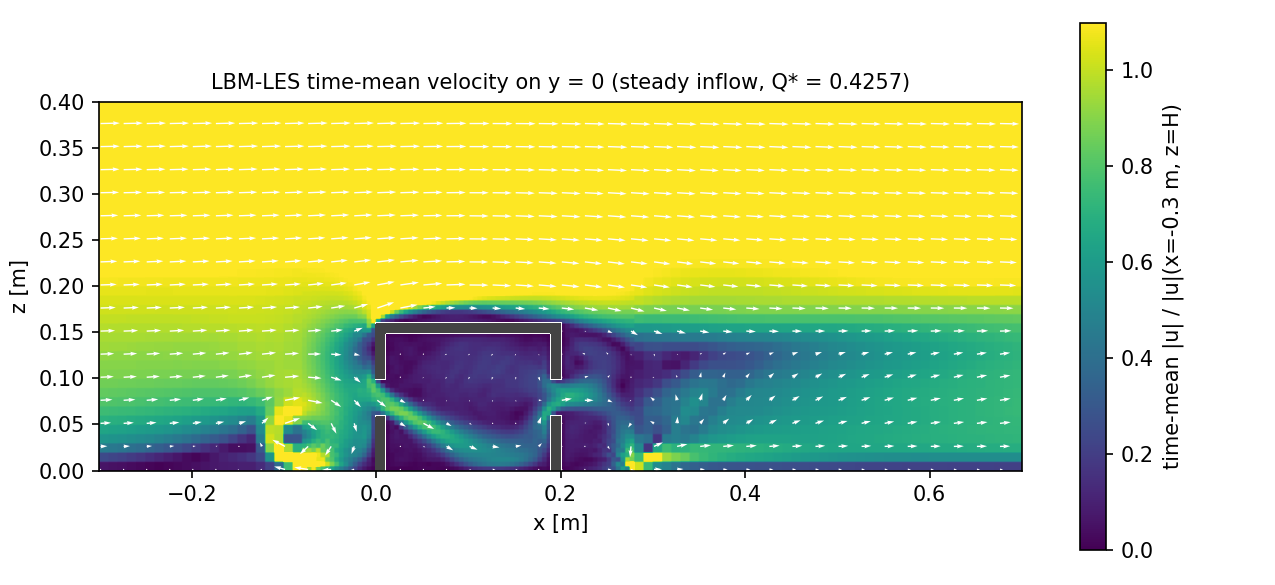
- Grid convergence of the LBM: solving the opening with 18×8, 36×16 and 27×12 cells gives 0.4256, 0.4082 and 0.4258 (4 times the cells moves it by only 4.1 %, §10).
- The OpenFOAM steady solution does not converge. From 3000 → 7000 iterations the flow difference between the 2 openings goes from 11.87 % → 11.82 %. The value is therefore the mean of the 2 openings, and the error bar is half the difference (§14).
- Inflow-velocity correction: the experiment divides by the inflow velocity at the model position, whereas our values divided by a velocity 1.0527 times smaller than that. After correction: 1D 0.4099, LBM 0.4018, FVM 0.4146 (difference from the experiment +61 to 66 %, §17).
The difference from the experiment is not explained¶
Design document §12 explained that "the tracer-gas method measures an effective ventilation rate by dilution, so it comes out smaller than the volume flow through the openings", but §13 withdrew this as wrong. With short-circuiting, the tracer method is biased toward overestimating the volume flow, which is the opposite sign to what is observed. The paper also states that the tracer was released so as to mix well in the room, so 0.25 and our 0.42 are the same quantity.
Since then 8 candidate causes have been eliminated by measurement, and none of them reduced the difference (§17 to 18). A separate experiment with PIV on the same geometry (Karava et al. 2011) gives about 0.40, within 6 % of the 3 methods. The conclusion is "not a discrepancy with a known cause, but a discrepancy after careful investigation" (§18).
Open points¶
- The opening size was originally taken as 0.09 × 0.04 m (3.6 × 10⁻³ m², 9 % larger) and was corrected to 3.3 × 10⁻³ m² to match the paper (§17). The description in the benchmark header still has the old dimensions.
- The "implicitly determined discharge coefficient" 0.639 in the 1D row is the same as the value in the LBM row. The default of the 1D model is 0.65.